Getting Bulk Fermentation Right When Batch Sizes Grow
Fixed-time bulk schedules that work at 10 kg routinely could fail at 200 kg, producing uneven acidification, collapsed crumb, and batch-to-batch inconsistency. When fermentation timing is governed by pH evolution, gas retention curves, and gluten degradation thresholds rather than a clock, large-scale bulk becomes reproducible and controllable.
In medium and large-scale bakeries producing artisan-style bread at industrial throughput, bulk fermentation remains the single most consequential process step for crumb structure, flavor complexity, and shelf stability. Yet most production schedules still anchor bulk duration to fixed clock intervals (typically 45 to 90 minutes for direct processes, or 12 to 48 hours for retarded methods), often without reference to the biological markers that actually govern dough readiness.
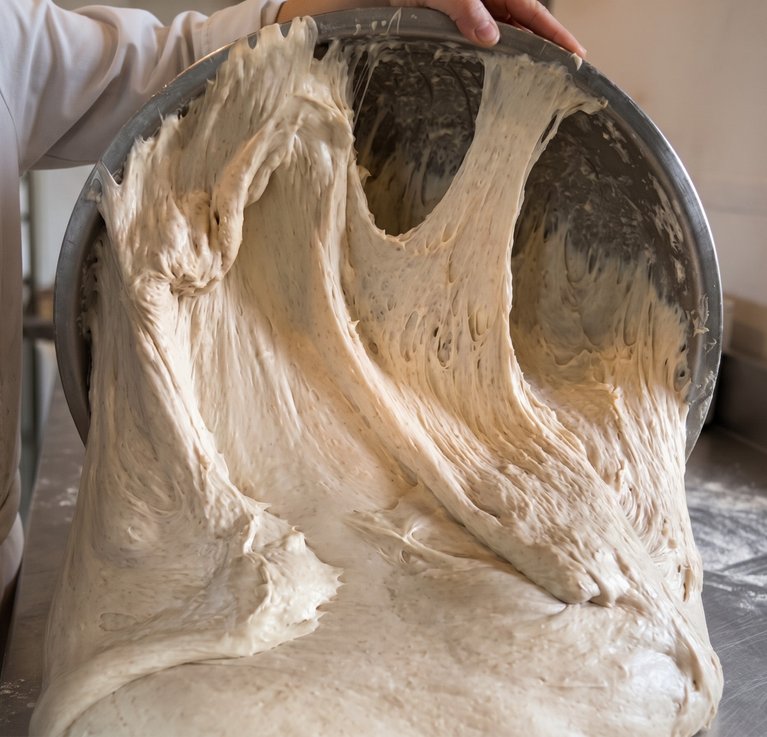
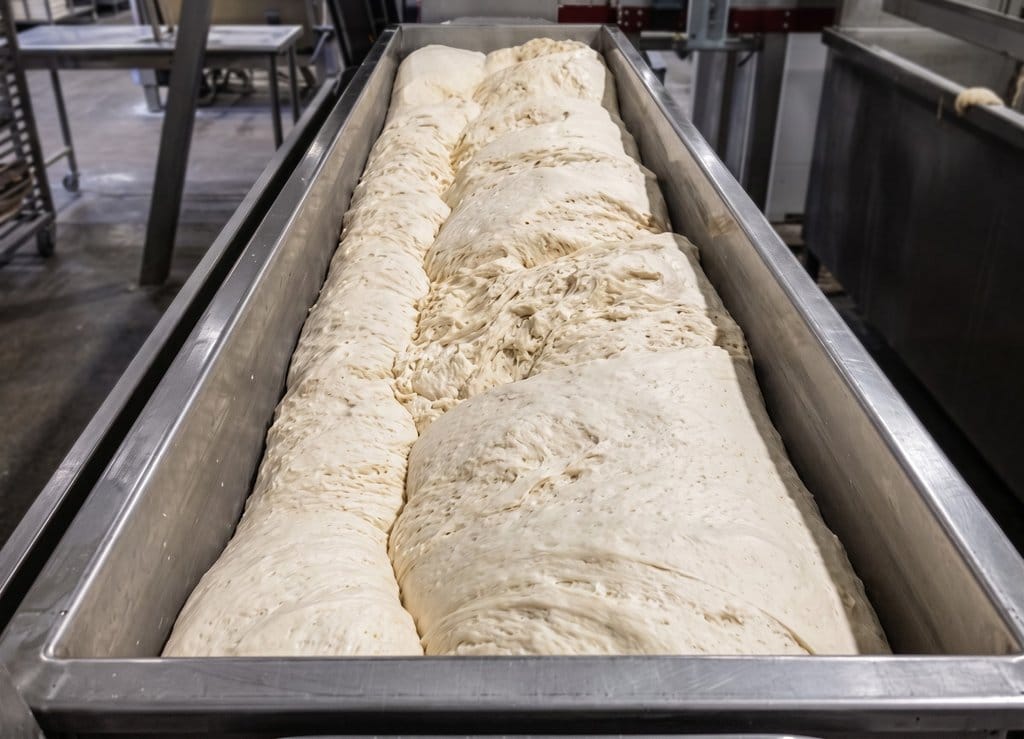
This matters at scale because large dough masses behave as semi-adiabatic bioreactors. A 250 kg batch in a stainless steel trough generates measurable metabolic heat, with core temperatures rising +1.8°C to +3.6°C over a 2 to 4 hour window. That thermal drift accelerates microbial activity in the center while the periphery remains cooler, creating spatial gradients in pH, gas density, and gluten degradation that a 5 kg artisan batch simply does not experience (Ribet et al., 2026).
The practical consequence is direct:
The same 90 minute bulk that produces an optimal loaf in a 10 kg batch may yield an over-acidified, structurally compromised result in a 200 kg trough, unless the operator understands which biological processes are driving the timeline.
What Happens Inside the Dough: Microbial Succession and Enzymatic Cascades
Bulk fermentation is not a single event. It unfolds as a sequential relay of microbial populations and enzymatic reactions, each dominating a specific time window and contributing distinct sensory and structural outcomes.
Stage 1, Initial Phase (0 to 2 hours): Yeast Dominance and Primary Gas Production
Saccharomyces cerevisiae activates first, consuming the small fraction of free sugars (glucose, fructose) already present in the flour, roughly 1.0% to 1.5% by weight.
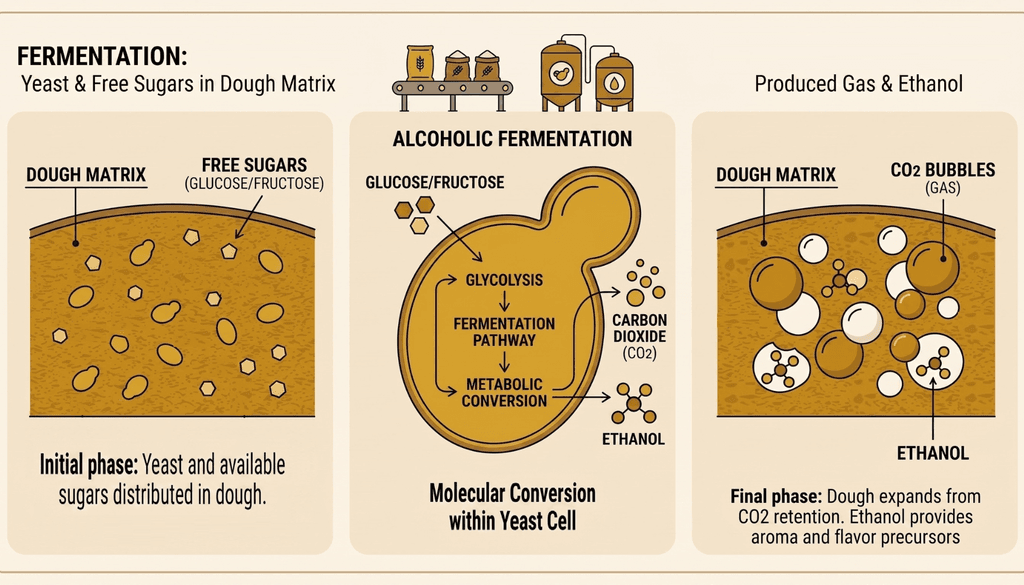
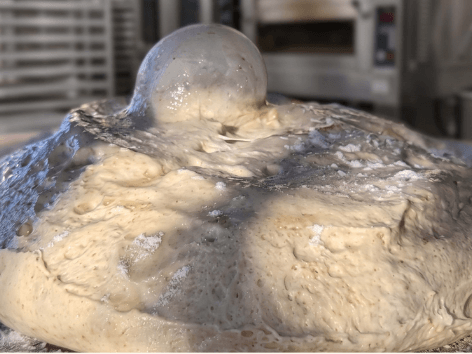
At standard commercal dosing, pressed or liquid yeast carries enough viable cells to begin producing gas almost immediately, typically within the first 15 to 20 minutes after mixing. During this window, the primary outputs are ethanol and CO₂, and the pH drops moderately from around 5.8 to 5.2 as dissolved carbon dioxide acidifies the aqueous phase.
Sensory contribution at this stage is limited. Ethanol provides the base solvent for later ester formation, but the flavor profile remains largely neutral.
Stage 2, Mid-Phase (3 to 8 hours): Bacterial Activation and Acid Production
Once free sugars are exhausted, lactic acid bacteria (LAB) become metabolically dominant. The key species include:
The dominant bacterium in traditional sourdoughs. It feeds primarily on maltose, producing a mix of lactic acid, acetic acid, CO₂, and ethanol. It also releases free glucose into the dough, which sustains symbiotic yeasts like Kazachstania humilis that cannot break down maltose on their own. Its acetic acid output gives bread a sharper, more aromatic acidity and contributes to longer shelf life by inhibiting mold growth.
At the same time, the organic acids it generates progressively soften the gluten network, increasing extensibility but reducing elasticity over time.
Produces almost exclusively lactic acid. This translates into a milder, rounder acidity with dairy-like, yogurt-adjacent notes. Because lactic acid is a weaker gluten softener than acetic acid, doughs dominated by this species tend to retain more structural strength and gas-holding capacity during longer fermentation windows.
Generate both lactic and acetic acid alongside CO₂ and ethanol. Their balance between the two acids shifts depending on hydration and oxygen availability, making them key modulators of whether the final bread profile leans creamy and mild or sharp and vinegar-forward. In high-activity scenarios, their combined acid output can accelerate gluten weakening, so their population density should be monitored in extended bulk schedules.
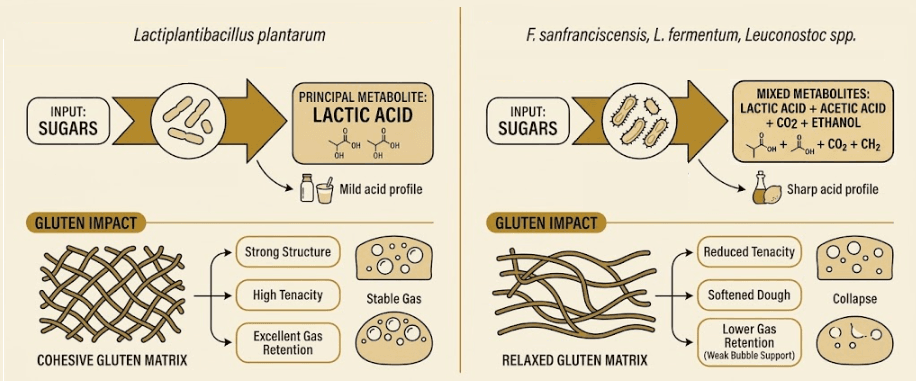
The balance between lactic acid and acetic acid is one of the most useful indicators of how the final bread will taste.
It is commonly expressed as the Fermentation Quotient (FQ), which is simply the ratio of lactic acid to acetic acid in the dough. An FQ of 3.0, for example, means there are roughly 3 parts of lactic acid for every 1 part of acetic. Industrial targets typically aim for a range of 3.0 to 4.5, which delivers a balanced acidity, neither too sharp nor too flat.
When the ratio drops below 2.5 (proportionally more acetic acid), the bread tends toward an aggressive, vinegar-like sharpness, and the gluten network weakens faster. When it rises above 6.0 (overwhelmingly lactic), the flavor becomes one-dimensional, missing the aromatic freshness and the antimicrobial shelf-life benefits that acetic acid provides.
Stage 3, Extended and Cold-Retarded Phase (12 to 48+ hours at 3°C to 5°C)
When the bulk transitions into refrigeration, yeast activity drops by over 95%, effectively pausing gas production. However, cold-tolerant lactic acid bacteria continue working at a slow, steady pace, gradually accumulating organic acids and aroma precursors. This is where the complexity of long-fermented bread really develops: malty and toasted notes, honey-like and floral aromas, fruity hints reminiscent of apple or banana, and buttery undertones all build up quietly during this cold phase.
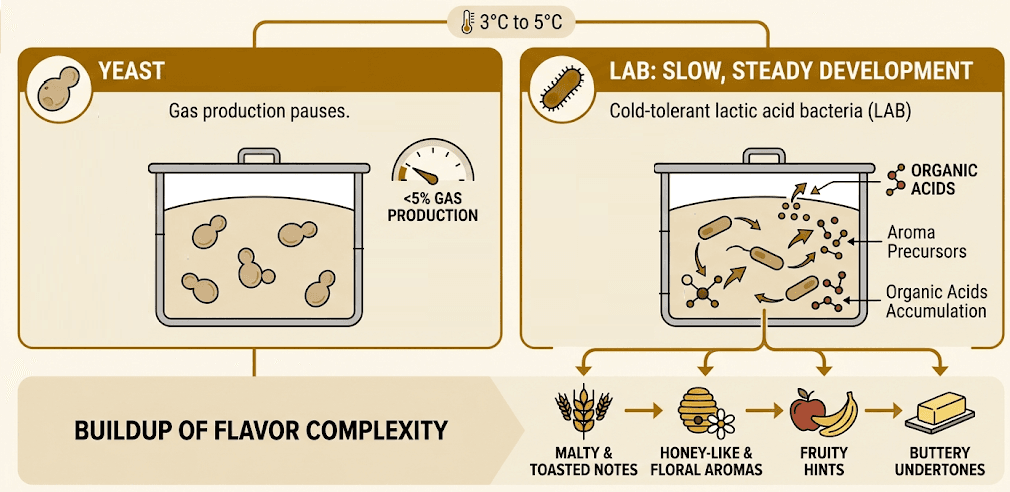
These compounds later intensify during baking through caramelization and Maillard browning, producing the deep, layered crust flavor that distinguishes slow-fermented bread from rapid-process loaves..
Variables That Govern Fermentation Duration
No single factor dictates bulk time. The following variables interact simultaneously, and adjusting one inevitably shifts the others:
Recommended Reading:
How Hydration Shifts Acid Balance and Dough Strength
Hydration is not just about dough feel and handling. It directly changes how fast microorganisms work, which acids they produce, and how quickly the gluten breaks down.
At 55% to 60% hydration (standard pan breads, candeales), the dough is dense and stiff. Nutrients and enzymes move slowly through the matrix, which limits how fast bacteria and yeast can feed. In this environment, lactic acid bacteria tend to produce proportionally more acetic acid, pushing the FQ down to 2.0 to 3.0. The result is a sharper, more pungent flavor profile.
At 75% to 85%+ hydration (ciabattas, focaccias, high-hydration rustics), everything speeds up. More free water means enzymes reach their targets faster, and gluten breakdown accelerates by 30% to 45% compared to a 60% hydration dough at the same temperature and pH. The acid profile shifts toward lactic acid dominance (FQ 4.5 to 6.0), producing a milder, creamier acidity. The tradeoff is that the gluten network weakens faster and gas cell walls become thinner, increasing the risk of bubbles merging or the dough collapsing if bulk time is not shortened accordingly.
Recommended Reading:
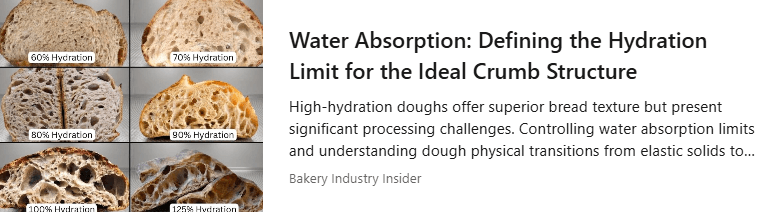
For high-hydration formulas, consider reducing ambient-temperature bulk time by 15% to 25% relative to standard hydration protocols, and ensure division occurs before gas retention drops below 85%.
The Warm Start
Yeast needs a warm startup window to “wake up” after mixing. If the dough temperature drops abruptly by more than 15°C before yeast has had time to activate its fermentation machinery, the cells essentially shut down. They shift into a protective survival mode instead of producing gas. Once locked in this state at 4°C, reactivation takes far longer than most production schedules allow.
There is a second, equally important reason: yeast and bacteria do not create new gas bubbles. Every bubble in the final crumb originates from the tiny air pockets trapped during mixing. For CO₂ to inflate those air pockets, the dough must first become saturated with dissolved gas, and that only happens efficiently at warm temperatures (24°C to 26°C). At 4°C, CO₂ stays dissolved in the water instead of migrating into the air pockets, so no inflation occurs.
Recommended Reading:
The minimum conditions before transferring to cold retard at 3°C to 5°C are:
- 60 to 90 minutes of warm floor time at 24°C to 26°C (adjusted for inoculum type and dosage)
- Volume increase of +35% to +50%
- pH drop of 0.3 to 0.5 units from the initial dough pH
- Visible small bubbles and elastic spring when pressing the dough surface
This warm start can be replaced by using a highly active preferment (poolish, biga, or mature Type I sourdough at 25% to 30% of total flour), which effectively completes the startup phase and provides initial gas saturation before the final dough enters the retarder. Either way, the principle is the same: yeast must be active and gas must be inflating the air pockets before cold slows everything down.
Recommended Reading:
😊 Thanks for reading!
Sources:
- Gänzle, M.G. (2024). Lactic Acid Bacteria in the Fermentation of Non-Alcoholic Cereal Products. https://doi.org/10.1201/9781003352075-13
- Katina, K., Poutanen, K., Gobbetti, M. (2023). Nutritional Aspects of Cereal Fermentation with Lactic Acid Bacteria and Yeast. https://doi.org/10.1007/978-3-031-23084-4_10
- Wardhana, Y.R. et al. (2026). Impact of minerals on microbial species diversity and metabolite dynamics during spontaneous backslopped wheat sourdough productions. https://doi.org/10.1016/j.ijfoodmicro.2026.111747
- Wang, W. et al. (2026). Protein composition and rheological properties of liquid sourdough fermented by different lactic acid bacteria and yeast. https://doi.org/10.1016/j.crfs.2026.101499
- Yang, H. et al. (2024). Functional Characterization of Different Fructilactobacillus sanfranciscensis Strains Isolated from Chinese Traditional Sourdoughs. https://doi.org/10.3390/foods13172670
- Song, Q. et al. (2026). Metagenomics and volatile metabolomics reveal microbial succession and its correlations with fruity flavor volatile compounds. https://doi.org/10.1016/j.fochx.2025.103446
- Sathaiah, G. et al. (2026). Comparative assessment of food-grade osmolytes for enhancing yeast fermentation performance under salt stress. https://doi.org/10.1128/spectrum.00102-26
- Zadeike, D. et al. (2025). Effects of Co-Fermentation with Lactic Acid Bacteria and Yeast on Gliadin Degradation in Whole-Wheat Sourdough. https://doi.org/10.3390/fermentation11050238
- Pourmohammadi, K., Abedi, E. (2021). Hydrolytic enzymes and their directly and indirectly effects on gluten and dough properties: An extensive review. https://doi.org/10.1002/fsn3.2344
- Liang, J. et al. (2026). Synergistic Interaction Between Kazachstania humilis and Fructilactobacillus sanfranciscensis Modulates Metabolic Reprogramming. https://doi.org/10.3390/foods15101745
- Boudrag, S. et al. (2026). Effect of NaCl Reduction on Dough Rheology and Bread Quality of Fibre-Enriched White Wheat Bread. https://doi.org/10.3390/foods15132343
- Li, S. et al. (2026). Mitigating long-term deterioration of frozen dough: Isothermal-buffered frozen storage for stabilizing water mobility. https://doi.org/10.1016/j.fochx.2026.104085
- Murniece, R. et al. (2024). Impact of Rye Malt with Various Diastatic Activity on Sugar Formation in Scalding and Fermentation Processes. https://doi.org/10.3390/foods13132077
- Qi, Y. et al. (2025). Maillard Reaction in Flour Product Processing: Mechanism, Impact on Quality, and Mitigation Strategies. https://doi.org/10.3390/foods14152721
- Ribet, L. et al. (2026). Fermentation in breadmaking: enhancing digestibility and nutritional value for gastrointestinal health. https://doi.org/10.3389/fnut.2026.1777596
- Perri, G. et al. (2025). Tailor-made fermentation of sprouted wheat and barley flours in bread making. https://doi.org/10.1016/j.crfs.2025.101053
- International Bakery Magazine. Precision in Fermentation: Scaling Sourdough with Smart Automation. https://in-bakery.com/precision-in-fermentation-scaling-sourdough-with-smart-automation/